Reading Single Mass Spectra for Large Molecules
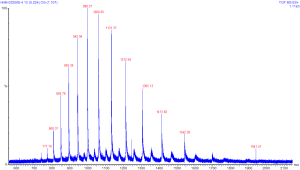
A mass spectra for a large molecule will almost always involve reading a single mass spectrum (as opposed to a tandem or ms^n spectrum). Equally important to consider is the nature of a large molecule, and how it may acquire charge in the ionization process. As discussed earlier, the x-axis of a mass spectra shows the mass-to-charge ratio. This ratio has specific implications for a molecule where the charge is multiple and variable - which occurs frequently with molecules whose masses are several kilodaltons or more. The variable (though integer!) value of charge for members of a single population will result in what is referred to as the charge envelope. The charge envelope for a common protein standard Horse Heart Myoglobin (HHM) is shown below.
 You can click on this image to see a larger version
of this spectra. The numbers in red on this image are the values of
mass-to-charge for ions observed in the instrument. The scale at the
bottom of the image shows the m/z range that we were scanning for this
molecule - approximately 550 to 2,200. The height of the peaks can be
thought of as relative intensity for the population - hence there were
more ions observed at 998.37 than at 1060.65.
This image illustrates the concept of a charge envlope, which results from the ionization of a larger molecule in mass spec. These peaks all correspond to the same molecule, just with different charges. As we recall, mass spectrometry observes the mass-to-charge ratio of molecules - hence with charge in the denominator, lower values of m/z correspond to more highly charged molecules. Remember also that charge is quantized as an integer - we'll see the importance of this in a moment.
The charge envelope therefore shows the distribution of charge states for a population of molecules. However, the m/z values themselves - particularly with regards to the value of the charge - also have some additional information. While many large molecules will take up charge such that their charge envelope will be within the range of 0-4,000 m/z, the location within this range is determined somewhat by the accessible surface area of the molecule, and then affected by the ratio of mass to surface area. The HHM molecule whose spectra is shown is largely globular in shape, which means that the total surface area per unit mass is fairly low. Molecules which are more elongated in structure will have more accessible surface area, and hence take on a larger charge for their total mass.
With the spectra obtained for a large molecule, we are still one step away from accurate mass. The next step is to take the charge envlope and solve for the mass of the molecule. This will take advantage of the quantized (integer) nature of charge state, through a process called deconvolution.
Deconvolution can be done manually by taking the numeric value of each peak from the spectra, and entering it into a list. The next step is to then divide the list of peak values by a list of integers, and put the resulting numbers into another list. The integer values need to be iterated by one for each successively smaller value of m/z. For example, if you choose the integer value of "16" for the m/z value of "1060.65", then you would use the integer value of "17" for the m/z value of "998.37". The deconvolution is most accurate when the numbers on the second list are most in agreement.
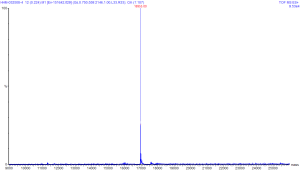 This image is the result of deconvolution of
the earlier spectra of Horse Heart Myoglobin (HHM). You can click on this
image to see a larger version of the same image. This deconvolution was
done by software, and the tallest peak shows the solved mass from the
software that was mathematically "most probable".
The deconvolution graph reads with the units of mass on the x-axis, and intensity (or probability) on the y-axis. When loading a mixture of molecules, it is possible to solve for the components of a mixture if the components are of suitable purity. In the software that was used for this deconvolution, the only input parameters are the range on which to solve the mass, the software will automatically deconvolute to some number of masses to fit the spectra data.
Reading Single Mass Spectra for Small Molecules
Small molecules behave slightly differently in a mass spectrometer than those of larger mass. In particular, a smaller molecule will seldom exhibit the charge envelope that we saw from HHM, at least partially due to the fact that smaller molecules have fewer accessible atoms to acquire additional charge in the mass spectrometer. However, we will see that small molecules still are able to take up multiple charges and give a narrow distribution of m/z values that can be used to determine mass.
The images for this section are based on runs of Glu1-fibrinopeptide B; which will be referred to as "glu-fib" in this write-up. Glu-fib is a readily available peptide that is commonly used as a mass spec standard, we will see in tandem mass spectrometry how we can solve its amino acid sequence.
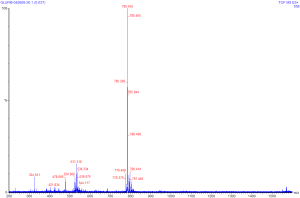 A generic approach to tandem MS for a compound of good purity is to
start with a single MS run, in much the same way that would be done
for a larger molecule. The known mass of glu-fib is 1,570.57; the
spectra is shown at right (clicking on the spectra will give a larger
version of the same image). Much like with the spectra seen
previously for HHM, the X axis of this spectra is in units of m/z,
and the Y axis is units of intensity.
We can see by this spectra that Glu-fib
is present in +2 (~785 m/z) and +3 (~531 m/z) and possibly +4 (~324
m/z) species. For tandem MS we will want to choose the most
prevalent species with a charge state of 2 or higher (in this case
785, a +2 charge).
A similar deconvolution technique can be applied to this spectra to solve for the mass of the original molecule. However, as the molecule we just saw was a peptide (as opposed to a full-length protein), the mass of the molecule is not as valuable as the information that we will obtain in tandem mass spec on the peptide sequence.
Reading Tandem Mass Spectra for Small Molecules
Now that the single mass spectra has been observed for glu-fib, we can proceed to a tandem mass spec (MS^2) run for the same molecule to observe its component amino acids. On our mass spectrometer we will use argon gas (Ar) to induce the fragmentation of glu-fib to observe its daughter ions.
The hybrid setup of our Q-TOF mass spectrometer allows us to use the quadrupole to both observe and select ions as they pass through the instrument. Having observed the single MS spectra shown earlier for glu-fib, we can now use the quadrupole to select the parent ion species that we want to use for fragmentation. In this case we will select for the m/z equal to 785.
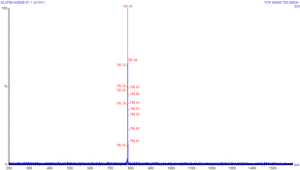 This image is the result of using the quadrupole
to filter the mass spectra of glu-fib and select ions that have
m/z equal to 785. On this run, no collision gas is used, so the
parent ions travel through to TOF without fragmentation. You can
click on this image to see a larger version of the same. Notice
that none of the other ions from the previous spectra are present
in this acquisition; this tells us that the quadrupole is doing
its job as a mass filter correctly. If unwanted ions were to
pass through the quadrupole and undergo collision in the
collision cell, the product tandem spectra would be the product
of a mixed population of collision products, which would be much
more difficult to interpret.
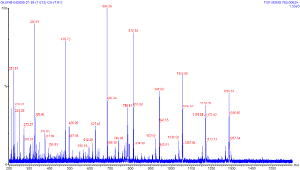 Once an ion has been selected for
collision, we can introduce collision gas to produce
daughter ions. The image at right shows the product of
selecting for ions at 785 m/z and using argon gas under
pressure to fragment the peptide. You can click on this image
to see a larger version of the same. Notice that this image
does include a peak at 785; this tells us that we
likely did not fragment all the ions introduced into the
collision cell. In this case a lower flow rate to the ESI
source likely could have helped to improve the fragmentation
rate.
Notice also that the spectra of the daughter ions shows peaks of both lower and higher m/z values than the selected value of 785. This may seem to be a strange pehonomenon to a novice, as of course these daughter ions should all be of a mass equal to or lower than the parent ion. What could cause the appearance of higher m/z values, then? The answer to this lies in the charge distribution on a molecule. If one were to consider that on this short peptide there are 9 amino acids; each amino acid has roughly equal chance of picking up a proton (and hence a +1 charge) in solution. We are selecting for the +2 species, if each amino acid can pick up only one proton, there are 9^2 = 81 possible charge combinations that could lead to a +2 charge. And remembering that charge is a quantized integer, we know that a daughter ion from a +2 parent can only have a charge of zero, +1, or +2 (we won't be able to detect the zero charge daughter ions). Hence it is possible to have a daughter ion that has most of the mass of the parent, but only half the charge, which will end up with a higher m/z value than the parent. Therefore even though our parent species had a m/z value of 785, we need to scan for ions up to the +1 state ( 785 *2 = 1570) to see all the possible daughter ions.
| Chapter 3: Single, Tandem, and ms^n Mass Spectrometry | Mass Spectrometry For Dummies | Chapter 5: Liquid Chromatography |
|---|
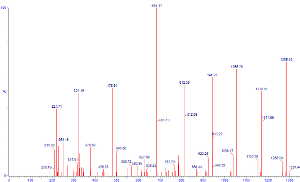 We can also adjust the parameters of our mass spectrometer to
favor more complete collision of the parent ion - and hence better
confidence of the identities of the more prevalent daughter ions.
Here we can see that the parent ion species at 785 is almost
completely absent, which implies near complete collision of
that species. One also sees much better defined peaks in this scan than
what were present in the previous.
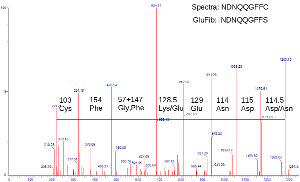 We
now have a clear enough tandem mass spectra that we can annotate the data
to attempt to identify the species present. A crucial piece of information
at this stage to know is the masses of the essential amino acids; this
allows us to use the mass differences between daughter ions to
determine which amino acids have been removed in the collision. Amongst
the 20 amino acids, there are only two (leucine and isoleucine) whose
masses are identical. Hence with good mass accuracy, determination of
peptide sequence is very straightforward. As seen in this spectra,
we were able to sequence glu-fib to NDNQQGFFC - which differed only by
one amino acid from the expected sequence of NDNQQGFFS. On this spectra
we also see the amino acid glycine - the smallest by mass and structure -
is hard to distinguish from its neighbor; however there is a gap between
adjacent peaks that correlates with the mass of glycine and another
amino acid; in this case phenylalanine.